How Much of the News Is About Donald Trump? Measuring the Media Buzz Behind the Headlines
An independent, data-driven web application that tracks and visualizes the attention Donald Trump receives in English-language news media.
Role
Project Idea & Product Concept · Analytical Methodology · Visual Identity & UI Design · Information Design & Data Visualization · AI-Assisted Product Development with Claude Code
Built with
Python · spaCy · sentence-transformers · PostgreSQL · Supabase · React · TypeScript · Recharts · Vercel
Project
Independent side project · Launched November 2026
Making media attention visible
Donald Says explores how automated data collection, text analysis and interactive data visualization can make patterns in media coverage visible and accessible to a broader audience.
The underlying idea is to treat media attention as a measurable phenomenon. Rather than focusing on individual news stories, Donald Says provides an aggregated view of how often Donald Trump appears in the headlines, which topics are associated with him and how media coverage changes over time.
Measuring media attention
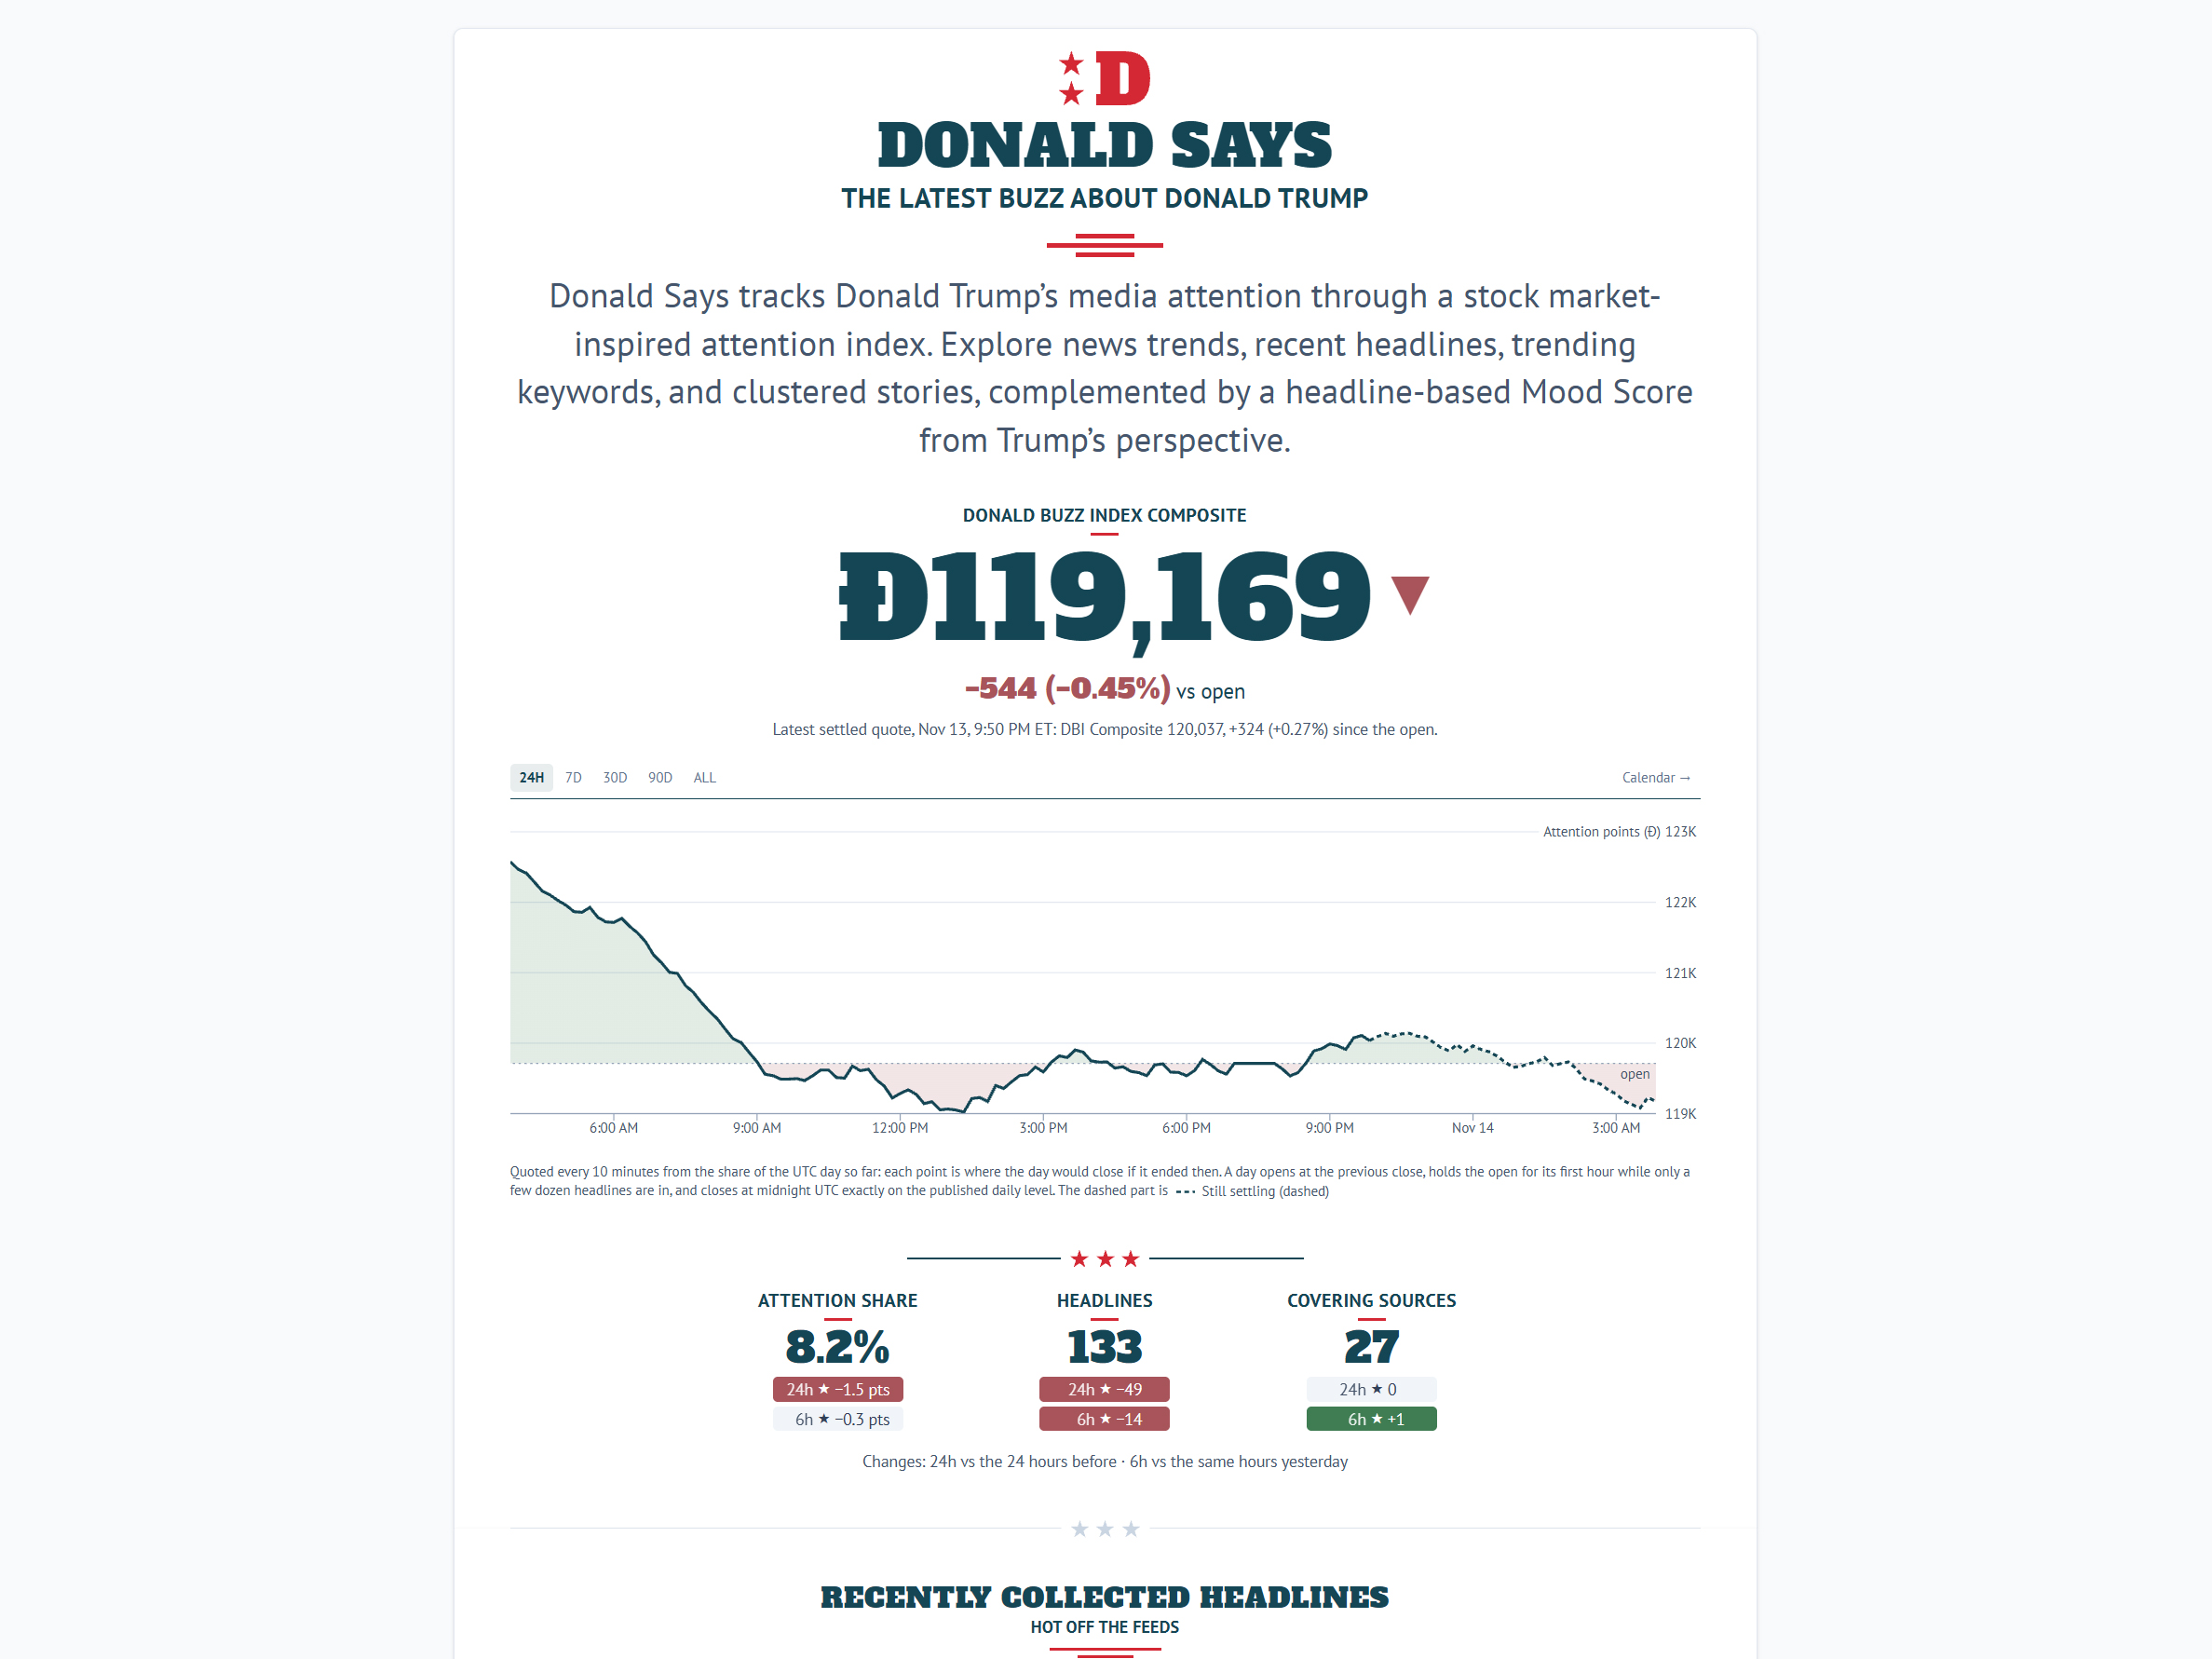
At the heart of the application is the Donald Buzz Index (DBI), a custom metric that expresses media attention relative to a reference baseline. An index value of 100 represents the baseline level of attention, while higher or lower values indicate corresponding changes in media coverage. In the style of a stock market index, the daily values are also compounded into the DBI Composite, which rises and falls with media attention from day to day.
An automated data processing workflow collects headlines from 112 English-language news feeds (as of November 2026) every ten minutes. A fixed panel of 29 of these feeds provides the basis for the index, while the full collection is used to identify trending terms, emerging topics and groups of related news stories. This distinction keeps the basis for measuring attention consistent while drawing on a broader range of sources for content exploration.
The index deliberately focuses on media attention. It does not measure political sentiment, popularity, public approval or the importance of individual news stories.
Exploring news and emerging topics
The interactive dashboard offers different perspectives on media coverage. Users can explore historical changes in the Donald Buzz Index, discover trending topics and examine groups of headlines covering related events. A “Buzzing now” section highlights terms that are appearing well above their usual level for that time of day. Individual topic pages, historical views and a map of monitored news sources provide further ways to explore.
Automated text analysis identifies recurring terms, people, organizations and topics within the collected headlines. Using sentence embeddings, related headlines are grouped into story clusters, helping users see which events are receiving attention without having to read through hundreds of individual news articles.
The data is processed automatically and published to the web application hourly. Information about data freshness, source coverage and data quality helps users understand the basis and limitations of the information presented.
Combining data and satire
A distinctive aspect of Donald Says is its combination of quantitative analysis and satirical information design. The visual concept draws on financial markets, borrowing familiar elements such as stock charts, market indices and price movements to create a playful representation of media attention.
Trending terms are presented with fictional stock prices in an invented currency, while a language model reads the day’s headlines from Donald’s perspective to produce a satirical interpretation of his mood. The underlying measurements remain unchanged; the satirical layer reframes them in the language of financial markets.
The design challenge was to create a coherent visual experience that balances entertainment with methodological transparency. The project explores how humor and familiar visual conventions can make complex information more approachable while keeping a clear distinction between factual analysis and satire.
From idea to digital product
Donald Says was developed as an independent project exploring AI-assisted digital product development: a publicly available web application that integrates automated data collection, analytical processing, data storage and interactive visualization. I developed the idea, product concept, visual identity and user interface, and iteratively refined the analytical methodology, adjusting how media attention and trending topics are measured and presented.
Claude Code was used for the software architecture, technical implementation and quality assurance. This approach allowed me to focus on conceptual decisions, analytical questions and the user experience while using AI to implement the technical requirements.